
Political Polling Accuracy Issues: Myth vs. Reality in 2026
- lionelleach
- May 25
- 12 min read

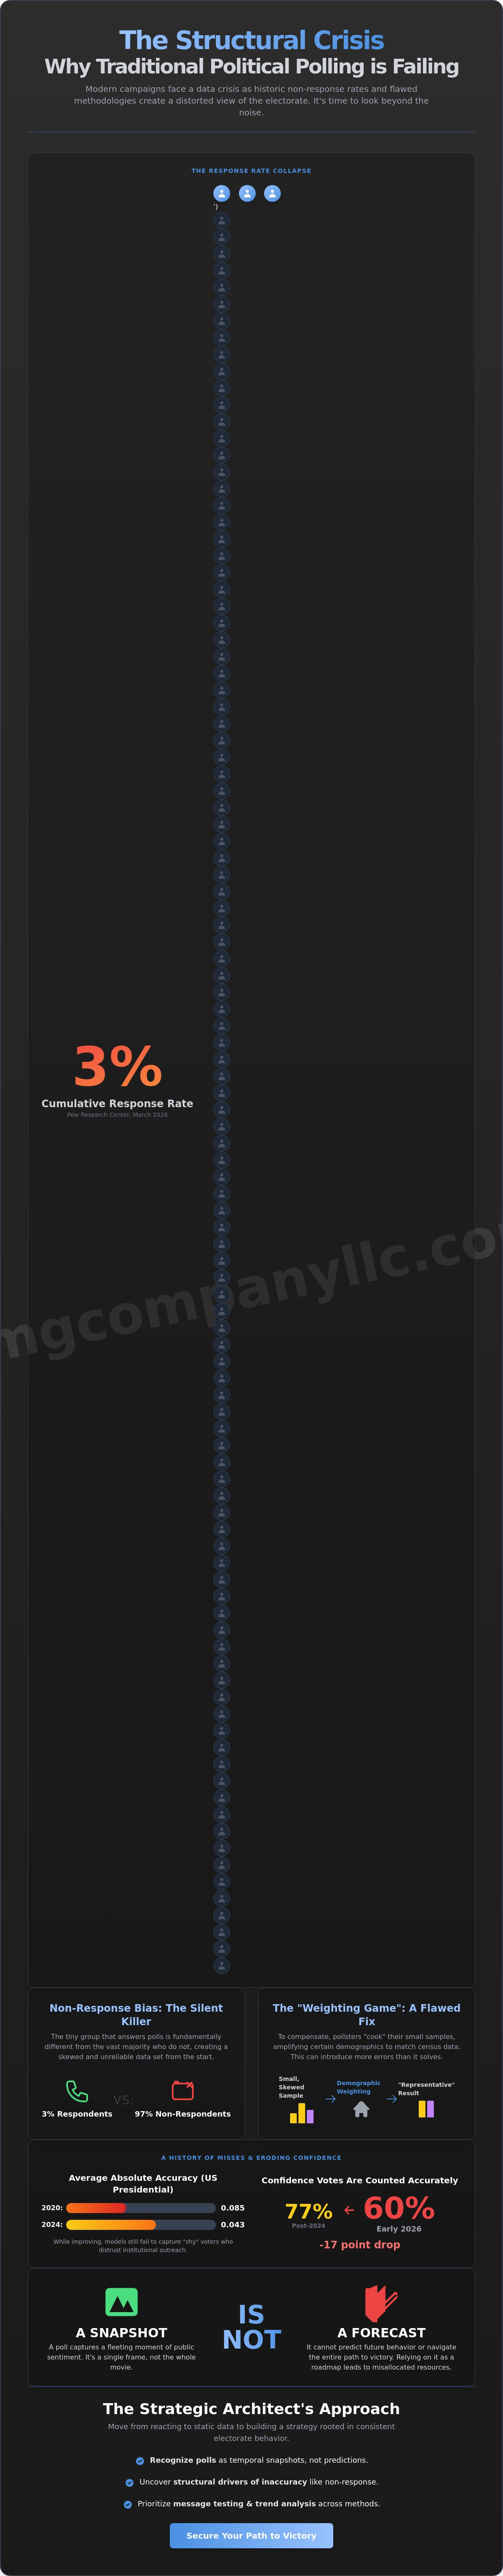
A Pew Research Center survey conducted in March 2026 yielded a cumulative response rate of just 3%. This staggering figure highlights a fundamental breakdown in how we measure the pulse of the electorate. If you feel that traditional surveys are failing to capture the reality on the ground, you aren't alone. Many campaign architects and strategic leaders are increasingly frustrated by political polling accuracy issues that lead to wasted spend and skewed narratives driven by outlier media data. You've likely seen how "likely voter" models often miss younger or non-traditional demographics who simply don't answer landlines.
It's time to look past the surface level noise. We'll uncover the structural reasons behind these modern polling failures and explain how a data-driven approach can restore clarity to your strategy. You'll learn to identify methodology red flags and discover modern alternatives to traditional phone-banking. By understanding the "why" behind these errors, you can move toward a more sophisticated model of public opinion polling and digital engagement that reflects the true state of the race.
Key Takeaways
Recognize that polls are temporal snapshots of sentiment rather than predictive forecasts, allowing for more realistic campaign expectations.
Uncover the structural drivers of political polling accuracy issues, from historic non-response rates to the inherent risks of demographic weighting.
Evaluate why the traditional margin of error is insufficient for measuring systemic bias and how to identify more reliable data signals.
Prioritize message testing and trend analysis across multiple methodologies to build a strategy rooted in consistent electorate behavior.
Leverage a strategic architect’s lens to navigate the hidden mechanics of public sentiment and secure a clear path to victory.
Table of Contents
The Snapshot Fallacy: Why Political Polling Is Not a Forecast
Campaign operatives often mistake a single poll for a permanent strategic roadmap. It's a mistake that costs millions in misallocated resources. A survey is a Polaroid, capturing a fleeting moment in a volatile environment, not a GPS designed to navigate the entire path to victory. When leadership treats these numbers as infallible, they ignore the inherent potential for inaccuracy in opinion polls. This misunderstanding fuels widespread political polling accuracy issues, particularly when media outlets prioritize "horse-race" narratives to drive digital engagement. These outlets often weaponize outlier data to generate clicks, a practice that prioritizes sensationalism over the structural reality of the electorate.
Success in 2026 demands a departure from this reliance on static data. Static surveys provide a flat view of a three-dimensional problem. Strategic architects now move toward dynamic electorate analysis and sophisticated public opinion polling services. This approach acknowledges that public sentiment is fluid and that a lead in June can evaporate by November if the underlying drivers of engagement aren't understood.
To better understand the distinction between data points and actual reliability, watch this helpful breakdown:
The Difference Between Sentiment and Turnout
Liking a candidate is a passive sentiment; casting a ballot is a logistical and psychological commitment. In 2026, surveys frequently encounter social desirability bias. This occurs when respondents provide answers they believe are socially acceptable rather than their true intentions, skewing the data toward perceived norms. This creates a dangerous gap between reported sentiment and actual turnout at the polls. Non-response bias is the silent killer of accuracy, occurring when the 3% of people who actually answer surveys differ fundamentally in their worldview from the 97% who do not.
Historical Context: Lessons from 2016-2024
Recent high-stakes elections exposed deep failures in traditional modeling. Analysis of the 2024 US presidential election showed an average absolute accuracy of 0.043, an improvement over the 0.085 seen in 2020, yet "shy" voters continued to evade traditional filters. These individuals often harbor a deep distrust of institutional outreach, making them nearly invisible to standard phone-banking. This skepticism is growing; as of early 2026, only 60% of respondents feel confident that votes will be counted accurately, a 17-point drop since the 2024 election. There is also a significant danger of over-correcting for these past errors in current 2026 models. If pollsters adjust their weighting too aggressively based on 2024's outcomes, they risk missing the unique, disruptive shifts occurring in the current cycle. Real precision requires a seasoned insider’s perspective to separate genuine trends from statistical noise and navigate political polling accuracy issues.
The Structural Crisis: Non-Response and the Weighting Game
The polling industry is currently grappling with a response crisis that threatens the foundation of traditional research. In March 2026, a Pew Research Center survey recorded a cumulative response rate of only 3%. This figure is not an anomaly; it is the new industry norm. The near-total obsolescence of landline-based outreach means that the vast majority of the electorate simply does not engage with standard survey methods. When only a tiny, self-selected sliver of the population responds, the resulting data introduces profound political polling accuracy issues. These errors cannot be fixed by increasing the volume of calls. Many firms opt for inexpensive automated IVR or "robocall" systems to cut costs, but these tools often fail to reach mobile-only users and younger voters, leaving a massive blind spot in any electorate analysis.
To compensate for these gaps, pollsters engage in what insiders call the "weighting game." They take their limited sample and "cook" the data to match census demographics such as age, race, and education. While statistically necessary, this process often masks the 95% confidence myth. In reality, the margin of error only accounts for sampling variability; it does nothing to mitigate systemic bias or the fact that the people who answer their phones are fundamentally different from those who don't. Relying on these skewed models leads to strategic paralysis when the numbers fail to manifest on election day.
The Science of Weighting and Its Limits
Weighting for education and geography is a common fix, yet it has distinct limits. When a sample size is small, weighting minority demographics or specific geographic pockets leads to extreme volatility. A single respondent's opinion can be amplified until it distorts the entire survey, creating "phantom trends" that don't exist in the real world. This is why Strategic Marketing Group prioritizes raw data transparency. We believe strategic architects must see the unweighted numbers to understand where the data is firm and where it is stretched thin. Understanding the raw sentiment is the only way to build a path to victory that isn't based on statistical illusions.
Identifying Flawed Likely Voter Models
Most pollsters define who is "likely" to vote based on outdated 2020 or 2024 turnout data. These models frequently fail to account for the massive shifts in early voting and mail-in ballot usage. Between January and May 2026, at least 6 states enacted expansive voting laws, while 9 states enacted restrictive ones. These changes fundamentally alter the timing and composition of the electorate. To spot a "junk poll," you must examine the cross-tabs. If the demographic breakdowns don't align with current registration trends or if the "undecided" percentage is suspiciously low, the model is likely flawed. For those seeking a more reliable path, engaging with seasoned campaign management can help separate high-quality data from noise.
Beyond the Margin of Error: The 95% Confidence Myth
The industry standard "95% confidence interval" is frequently misinterpreted as a guarantee of outcome. In reality, recent data suggests that election results land within that predicted interval only about 60% of the time. This discrepancy is a primary driver of political polling accuracy issues, as the public and many campaign managers rely on a margin of error that only accounts for random sampling variability. It completely ignores systematic bias, question wording, and the multifaceted challenges affecting political polling in a fractured media environment. A lead that appears "statistically significant" on paper is often a toss-up when viewed through a lens of seasoned authority.
Strategic architects utilize the Total Survey Error (TSE) framework to move beyond these surface-level metrics. TSE accounts for every potential point of failure, including frame errors, non-response bias, and processing mistakes. When a survey shows a candidate with a 3-point lead, it is mathematically a toss-up once you factor in the high probability of coverage bias. Relying on the margin of error alone is like checking the weather by looking at a map from last week. It provides a sense of security without the necessary context for high-stakes decision making.
Why Sampling Error is the Least of Your Worries
Random error is a manageable math problem. Systematic coverage error is a strategic disaster. The surge in "Internet Opt-in" panels has compromised true randomness, as these participants are often more politically engaged or motivated by incentives than the average voter. This creates a sample that looks right on a spreadsheet but doesn't reflect the actual community. Because of these variables, a 3-point lead in a standard survey should be treated as a statistical tie rather than a definitive advantage. We prioritize identifying these gaps to prevent our clients from falling into the trap of false confidence.
The Herding Phenomenon in 2026
As election day approaches, a subtle but pervasive trend known as "herding" often takes hold. Pollsters are frequently hesitant to publish outlier results that deviate significantly from the industry average, fearing the reputational damage of being "wrong" alone. This leads to a convergence where multiple firms produce nearly identical results, creating a false sense of certainty. You can identify herding when the results from ten different firms suddenly align within a single percentage point despite using different methodologies. The value of a disruptive, contrarian poll lies in its ability to identify swing trends that the herd is too cautious to report. Our approach focuses on finding the truth behind the noise, even when it challenges the prevailing media narrative. Addressing political polling accuracy issues requires the courage to look at what the data actually says, not what the competition is reporting.
Turning Data Into Strategy: Navigating Accuracy Issues
Understanding why surveys fail is merely the first step toward building a resilient campaign. The true challenge lies in making high-stakes decisions despite political polling accuracy issues. Strategic architects don't wait for a "perfect" poll that will never arrive. Instead, they pivot toward a multi-dimensional strategy that treats traditional data as just one piece of a much larger puzzle. This requires a methodical approach that prioritizes behavioral reality over reported intent.
Success in this environment follows a clear progression. First, look for trends across multiple methodologies rather than obsessing over a single survey's top-line number. Second, prioritize message testing polls over horse-race figures. Knowing which narrative moves the needle is far more valuable than a snapshot of a race that could shift tomorrow. Third, integrate digital signals and mobile engagement data to create a real-time feedback loop. Fourth, use "Benchmark" polls to set your strategic floor, not your ceiling. Finally, trust private electorate analysis over the sensationalized public media polling that often drives false narratives.
The Power of Electorate Analysis
Modern electorate analysis is designed to find the "hidden" voter that traditional models miss. We move beyond the standard question of "who are you voting for" to uncover what actually drives community engagement. This involves analyzing institutional influence and local leadership networks as primary data points. By identifying the social and economic pressures that dictate behavior, we can predict turnout with far greater precision than a 3% response rate survey ever could. This grounded approach ensures your strategy is rooted in the community's pulse rather than an abstract demographic profile.
Digital Signals: The Real-Time Poll
In a post-polling world, digital behavior serves as the real-time proxy for sentiment. Digital and mobile advertising metrics provide immediate data on which messages resonate with specific voter blocks. Voice and text broadcasting aren't just outreach tools; they are sensors that measure reengagement levels in key districts. We often utilize the SMG Video Truck as a physical catalyst for sentiment data, observing real-world reactions to visual messaging in high-traffic areas. When combined with geofencing technology, these tools allow us to track how voter interest ebbs and flows in response to campaign events. This dynamic feedback loop allows for rapid adjustments that traditional surveys simply cannot match. For those ready to move beyond flawed models, our campaign management expertise provides the steady hand needed to navigate these complexities.
The Strategic Architect’s Approach: Precision in a Post-Polling World
Precision in a post-polling world requires more than just better math; it demands a fundamental shift in how campaign leaders interpret the electorate. We reject the generic, one-size-fits-all approach to public opinion polling services that has led to so many high-profile failures. Standard data is a starting point. It isn't the finish line. Our methodology moves beyond descriptive data that merely explains what happened last week. We provide prescriptive data that outlines exactly how to win tomorrow. Political polling accuracy issues often stem from a lack of local context, which is why our strategic architecture is built on a foundation of institutional knowledge and community-rooted leadership.
Success in 2026 depends on a partner who understands the hidden mechanics of influence. With over a decade of New Jersey political experience, our firm interprets survey findings through a lens of seasoned authority. We know that a 66% confidence rating in state government, as reported in March 2026, means something very different in Newark than it does in a rural district. We validate every data point against the reality of local power structures and voter sentiment. This localized edge allows us to identify shifts in the electorate long before they appear in public media polls.
Beyond the Spreadsheet: The SMG Difference
We utilize digital advertising for campaigns to test messaging in real-time, creating a dynamic environment where strategy evolves with the voter. This disruptive approach allows us to bypass the 3% response rate trap of traditional surveys. By monitoring how specific demographics engage with digital content, we gain a clear view of which narratives are gaining traction. A strategic partner must do more than hand over a spreadsheet; they must navigate the complex systems of public sentiment with precision and confidence. Our focus on the unique political ecosystem of New Jersey ensures that our clients are never blindsided by "unforeseen" electorate shifts.
Securing Your 2026 Victory
The current political polling accuracy issues are not obstacles for the well-prepared; they are opportunities. When the rest of the field relies on flawed public data and outdated models, the campaign that invests in custom strategic architecture gains a decisive advantage. We combine high-level data analysis with a grounded respect for civic duty and leadership. Don't let your campaign's narrative be driven by outlier media polls or "likely voter" models that ignore the modern reality of the 2026 electorate. The path to victory is built on truth, not noise. Partner with SMG for data-driven campaign success and secure your place in the future of political leadership.
Master the Electorate with Strategic Precision
Navigating the 2026 cycle requires more than just reading the latest headlines. We've explored how the snapshot fallacy and historic non-response rates have rendered traditional models nearly obsolete. To overcome political polling accuracy issues, leadership must pivot from passive data collection to active electorate analysis. This involves integrating digital signals and mobile engagement to capture the true pulse of the community rather than relying on skewed census weighting that often masks the reality on the ground.
Strategic Marketing Group offers the seasoned authority needed to turn these data challenges into a competitive advantage. Led by prominent NJ political strategists like Lionel Leach, our firm brings over a decade of experience across more than 40 states. We are pioneers in mobile and digital voter reengagement, ensuring your campaign moves with the speed and precision of the modern voter. Don't leave your victory to chance or flawed public surveys. It's time to build a custom strategic architecture that reflects the genuine sentiment of your constituents.
Build your path to victory with SMG’s strategic polling services. The future of your campaign starts with data you can actually trust.
Frequently Asked Questions
Why do political polls keep getting it wrong in major elections?
Polls fail primarily due to historic declines in response rates and the inability to reach non-traditional voters. As of early 2026, cumulative response rates have plummeted to near 3%, meaning the vast majority of the electorate is never reached. This creates a dangerous reliance on demographic weighting that often fails to account for the "shy" voter effect or sudden shifts in voter behavior.
What is the most accurate way to poll voters in 2026?
The most reliable method is mixed-mode polling that integrates address-based sampling, text-to-web surveys, and digital sentiment analysis. Relying on a single outreach channel like landlines is a strategic error. By diversifying data collection, architects can reach younger demographics and mobile-only users who have abandoned traditional communication methods, creating a more representative view of the electorate.
How much should I trust the 'Margin of Error' in a political poll?
You should view the Margin of Error as a measure of sampling variability rather than a guarantee of accuracy. Industry research indicates that election results fall within the predicted 95% confidence interval only about 60% of the time. It doesn't account for systematic bias or non-response issues, which are the primary causes of political polling accuracy issues in modern campaigns.
What is non-response bias and how does it affect polling accuracy?
Non-response bias occurs when the people who choose to answer a poll differ fundamentally in their views from those who don't. When response rates are as low as 3%, the risk is extreme. If a specific subset of the population consistently refuses to participate, the resulting data will inevitably skew toward the opinions of more accessible respondents, leading to flawed strategic assumptions.
Can digital media data replace traditional political polling?
Digital data serves as a critical supplement but cannot yet fully replace traditional methodology. It provides real-time feedback on message resonance and engagement levels that static surveys miss. We use digital signals to validate survey findings, ensuring that what people say in a poll aligns with how they actually behave when they encounter targeted mobile or digital advertising.
Is there a difference between internal campaign polls and public media polls?
The primary difference lies in the objective and the level of scrutiny applied to the methodology. Media polls are often designed to generate headlines and digital engagement, which can lead to sensationalized "horse-race" narratives. Internal campaign polls are strategic tools used to identify vulnerabilities and test specific messaging, prioritizing raw accuracy and actionable intelligence over public perception.
How does Strategic Marketing Group ensure polling data is reliable?
We ensure reliability by layering raw survey data with localized institutional knowledge and real-world behavioral signals. Our team doesn't just look at spreadsheets; we interpret findings based on over a decade of experience in high-stakes environments. This approach allows us to identify and correct for political polling accuracy issues before they impact a campaign's strategic direction or resource allocation.
What are 'likely voter' models and why are they controversial?
Likely voter models are algorithms pollsters use to predict who will actually cast a ballot on election day. They are controversial because they often rely on historical turnout data that doesn't account for recent shifts in election laws. In 2026, these models face significant scrutiny as they struggle to adapt to the impact of new restrictive or expansive voting laws enacted across various states.
Comments